12

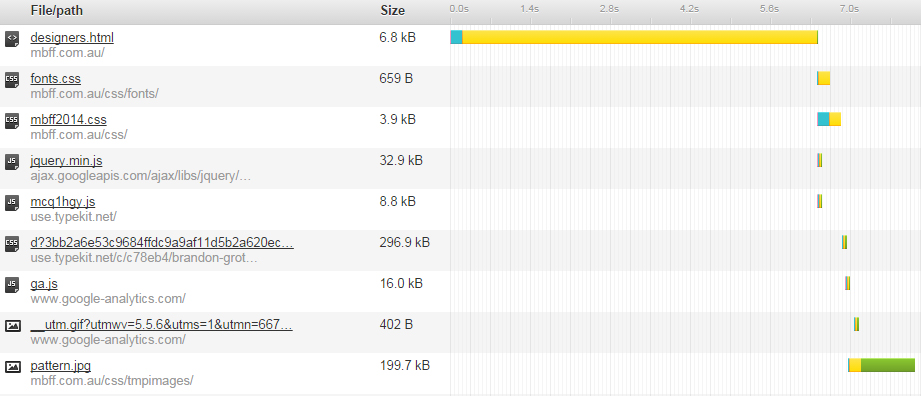
I have a website the seems to load very slowly. When I run a speed test on it I see there seems to be a 6 secound gap before the HTML loads. Images and JS scripts load very fast after that point.

You can see in the pic below the yellow 'wait time' bars:

Loading of the HTML file took more than 5 seconds, while most of the other assets load in under 1 second

This seems to be consistant no matter what the HTML content on the page is.

This site is using a CMS (ModX Revo) so HTML is actually stored in an SQL database and brought forth by PHP, but I've never experienced this issue before.

Would anyone know what is causing this and how I could speed it up?

3
  • Is this a new thing? That is, have these pages performed normally before and now performs poorly? Or is this a newer install/site? Can you tell us more?
    – closetnoc
    Commented Sep 5, 2014 at 0:36
  • 1
    Unless there is some intermediary network holding this up, then this would seem to be the time your server is taking to generate the response? You say "no matter what the HTML content" - HTML content through your CMS, or literally a static HTML page? I would certainly try a simple "Hello World" static HTML page if you haven't already. Also note that pingdom's servers are on the other side of the world to Australia (which I assume is where you are hosted)?
    – MrWhite
    Commented Sep 5, 2014 at 8:25
  • 1
    IMO the problem is primarily with that one page - your server/CMS seems to be taking a long time to generate the response. Inefficient SQL query?? Other pages on your site appear to be relatively quick. (?)
    – MrWhite
    Commented Sep 5, 2014 at 8:27

4 Answers 4

13

The technical term for waiting is refereed to as time to first byte and determines the responsiveness of a web server or other network resources.

Some common reasons you might see an high time to first byte:

  • Overloaded network (normally shared hosting)
  • Misconfiguration servers
  • Distance from you and the server (geo location plays a minor role)
  • Server errors (hops)

Generally this problem is often seen in shared hosting because of the sheer amount of websites and people visiting them which of course increases the network byte time. Another possible cause is an error on the network somewhere, like a hop or because your server is not within the location of your targeted audience, for example a 'GOOD' UK server will have a lower byte time than a US server targeting users in the UK, because of the distance that the data needs to be sent and received (Normally a increase of around 100-200ms).

Maybe a time to get a new host

In the past I have to move from server to server because of the lag of the time to first byte, you may be in the situation of having to choose a new web host or upgrade your current package.

Reliable testing

Testing the speed of your website from your home broadband is very biased because it may be a problem with your broadband not responding to the website. You should test your website using multiple connections from multiple servers... I recommend web page test and running multiple tests at once from different locations and many in the targeted geo audience. This will give you a better overview of whats going on, if its first byte then I recommend you contact your web host before anything else.

Pinging and trace route the server

If you attempt to run a ping on the server the results may display or may not, ping uses ICMP rather than UDP or TCP meaning its not like querying the server on port 80 which your httpd will be running on. You could use trace route to identify any servers on the route that could be causing the first byte to increase, again... it does not query the httpd server on port 80 and if traceroute using Windows it'll use ICMP and Mac/Linux machines will use UDP. It's worth testing because its such a quick and easy thing to do but if the results come back fine, doesn't necessary mean there isn't a problem somewhere.

5
  • Hi @SunWKim I've updated my answer with what you asked. Look at the bottom of my answer. Commented Sep 11, 2014 at 11:46
  • I agree on your common reasons for time to first byte. In this instance, however; I believe it has more to do with JavaScript code.
    – Sun
    Commented Sep 11, 2014 at 17:16
  • First Byte can be caused by a wide range of things but JavaScript is not one of them since the header response is before inline elements such as JavaScript, CSS, Images and so on. Don't confuse first byte with actual elements and files.. Commented Sep 12, 2014 at 8:58
  • I am not confusing the two. Maybe if you visited mbff.com.au and saw for yourself, you may be convinced it is not an issue of time to first byte. The delay is occurring after the first header response.
    – Sun
    Commented Sep 12, 2014 at 16:54
  • 1
    The delay is occurring after the first header response then that isn't first byte. First byte is the first response. Commented Sep 13, 2014 at 10:20
4

1) You have Adobe TypeKit which is not loading asynchronously with the current code. Try replacing it with the advanced asynchronous code: http://help.typekit.com/customer/portal/articles/649336-embed-code

This standard embed code takes advantage of the fact that tags block further rendering of the page to help prevent the FOUT [Flash of Unstyled Text]. While the Typekit script is loading, rendering of the page is blocked, so text won’t start to render with fallback fonts.

2) Test with new TypeKit. How is the loading time now? Better? Go to step 3.

3) Replace your Google Analytics with an updated JavaScript that provides the latest asynchronous syntax: https://developers.google.com/analytics/devguides/collection/gajs/

4) Test. Is the page loading better still?

5) Finally, consider optimizing images such as pattern.jpg. I converted it to a PNG and was able to reduce the file size from 199kB to 56kB. This reduces the time to receive the file: https://www.dropbox.com/s/i06jx509bmprhhh/pattern.png?dl=0

I hope this helps.

3

PHP vs. Non-PHP Elements

If you compare your non-PHP asset load times to your PHP based load times, you will see that the server responds quickly if PHP is not involved.

This typically indicates an issues internal to your PHP script.

The problem could be within the PHP layer or the database. Using advanced debugging tools like XDebug or NewRelic can help you quickly spot the bottleneck.

Time to first byte issues can be caused by hardware constraints, poor configuration or inefficient code. On shared hosting, hardware constraints and poor configuration are most likely.

In any case, solving the issue usually means one or all of:

  • More hardware
  • Better programming
  • Add Caching

Faster hardware is an obvious but often costly solution if you are already on dedicated resources.

Better programming may not be possible if the problem is internal to code you don't maintain or lack developer resources.

Caching helps by reducing the number of requests that must hit the underlying, poorly performing resources.

Testing

When using testing tools be sure to do multiple runs. Network and temporary server spikes can easily lead you down the wrong path, so you want to try to average these out.

Hosting

If you are on a shared hosting account, then consider moving to cloud or VPS type services so you have better insight into performance issues. Unless you use a caching technique (CDN or Cloudflare type service), correcting performance issues on mass shared hosting systems can be very challenging as you lack sufficient control of the server.
-1

Try setting third party cookies to only visited.

Your Answer

By clicking “Post Your Answer”, you agree to our terms of service and acknowledge you have read our privacy policy.

Not the answer you're looking for? Browse other questions tagged or ask your own question.