1

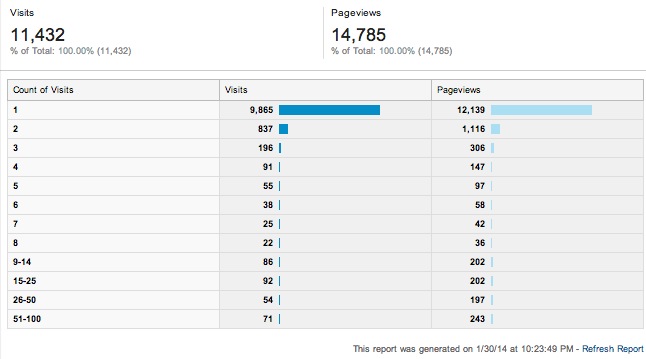
Here's a screen shot from Google Analytics. It's my last months traffic, and this is the 'Frequency & Recency' tab.

So I believe that if I add up all the numbers under 'visits' I get 11,432, which is right, and if I add up all the numbers under 'pageviews' I get 14,785 and that's right as well. But, let's take the last line - the last line appears to say that 71 people, visited more than 51 times each, and they viewed a total of 243 pages between them - that doesn't seam to make any sense - did they view 9% of a page each time?

So that's clearly wrong - what's the error in my calculation?
enter image description here

2 Answers 2

1

The numbers aren't cumulative as Sdoering said. If they were, the number of visits would keep going down while the number of visits go up. This isn't the case, so you each line is separate.

I think you have to read it as "all the people that visited my site 50+ times made 71 visits in total", so in this case it's a single person that visited 71 times and viewed 243 pages. I'm not 100% sure because there are an odd number of visits under 2, but Google's numbers are known to be off. Or at least the numbers they show you.

3
  • Actually the number of visits do keep going down - they only go up again when we start looking at wider margins... the 86 is spread amounst 5, and the 92 amounst 10... but it's a deeply unintutative way for google to be doing it - summing a cumulative slide... On hmm... On the other hand the number of pageviews isn't going down because the drop is too far to be mathamatically possible...
    – Joe
    Commented Feb 27, 2014 at 19:02
  • I think the point I'm making is that it could be 7 people turning up 52 times, 6 people turning up 53 times, the same six turning up 52 times, and when you sum the numbers from 51 to 100 you get 71...
    – Joe
    Commented Feb 28, 2014 at 9:09
  • I thought about that too, but then the numbers of pageviews don't make sense. And also, it doesn't add up for the numbers above that line... Commented Feb 28, 2014 at 9:19
0

As far as I understand this "slide" in Google Analytics, it is cumulative.

I'll try to explain with an example:

User 1: 1 Visit
User 2: 3 Visits
User 3: 2 Visits

This would show as

Count of Visits    |    Visits    |  Pageviews  |    Users
                   |              |             |
           1       |      3       |      3      |    Users 1 & 2 & 3
           2       |      2       |      2      |    Users 2 & 3
           3       |      1       |      1      |    Users 2

So the user making 3 visits (in this example every visit is just one pageview long) is counted in all three buckets, his first visit in bucket 1, his second in bucket two and so on.

That would mean, that only the pageviews of the 71 visits, that where produced by users returning more or equal to 51 times to your site. So these visits would have on average 243/71 pageviews per visit (or about 3.something).

It is quite difficult to explain, as English is not my native tongue. But i hope, I could help.

Your Answer

By clicking “Post Your Answer”, you agree to our terms of service and acknowledge you have read our privacy policy.

Not the answer you're looking for? Browse other questions tagged or ask your own question.