1

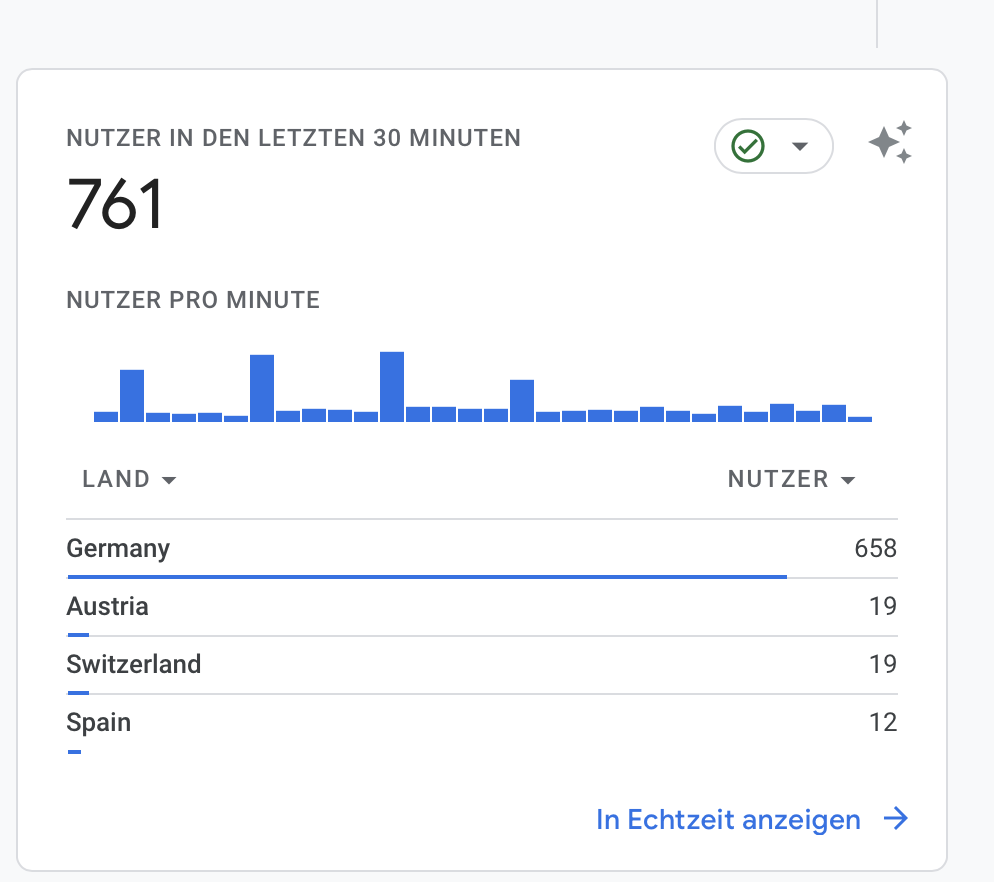
Sometimes the realtime figures in GA show surging peaks every 5 minutes.

This is not reflected at all in the server's access logs and is obviously a GA related issue:

  • The strange figures show up only in the afternoon/evening time.
  • After a couple of hours they become "normal" again without any changes made in the site in between.

It looks like GA is unable to count precisely and therefore estimates the "missing" signals in a 5 minute interval.

One explanation could be missing cookie consents. But to me it seems impossible that user's consent behavior changes dramatically in just a couple of hours.

Can anybody explain this behavior? May there be any external factors which I oversee?

GA real time figures

EDIT Here you see the regular traffic over a 24 hour period at it appears in the server's access logs: traffic in the access logs

5
  • 1
    Is the traffic noticeably higher at times when you see this? UA used to pause for ten minutes if the traffic was too high - support.google.com/analytics/answer/…
    – RichardB
    Commented May 10 at 11:00
  • No. There are no unusual traffic peaks. Generally, traffic goes up at 7am and then stays constantly at a high level until 11pm.
    – Abid
    Commented May 10 at 11:50
  • 1
    Could be batching on the client-side. Google speaks a little bit about this in their documentation: support.google.com/analytics/answer/… Commented May 10 at 15:01
  • To achieve the result described above, the batch processing clients must be in sync with each other. This seems to be very unlikely to me.
    – Abid
    Commented May 10 at 16:19
  • 1
    We're seeing this too, and have confirmed it's coming from the GA side. Commented Aug 16 at 15:44

0

Your Answer

By clicking “Post Your Answer”, you agree to our terms of service and acknowledge you have read our privacy policy.

Browse other questions tagged or ask your own question.