The help page for the Audience > Active Users report is a little confusing. It is referring to the numbers printed underneath the graph, and it doesn't apply directly to the graph.
The numbers listed underneath the graph will always refer to the last day of your date range. The values in the graph, however, display the active users for each day in your date range. In particular, your screenshot says there were 76,880 1-day active users for March 5. That is, there were 76,880 distinct users on the site on March 5, and if you changed your date range to end on March 5, the first value printed underneath the graph would be 76,880.
You can confirm that by comparing the numbers to the Audience > Overview report, changing the graph from Sessions to Users. The numbers per day will match.
I do not believe there is a report that gives either total sessions or total users per day in a table, only in the graphs. You could use the Google Analytics API to get that information in a table (the Google Sheets Analytics API add-on is probably easiest to get started with), or possibly pull the data into a Google Data Studio report. In my experience Data Studio reports require a lot of setup time and so are best if you will be using them repeatedly or want something that looks especially nice.
To see users who visited a page in a given day, you can get a good approximation from the Unique Pageviews metric in Behavior > Site Content > All Pages. It filters out most or all duplicate visits to a page within a single session, so if you have few people with multiple sessions in one day, it will be a fairly accurate number. You won't get day-by-day graphs this way; you'd need to pull the daily numbers out with the API or change your date range to each single day in turn.
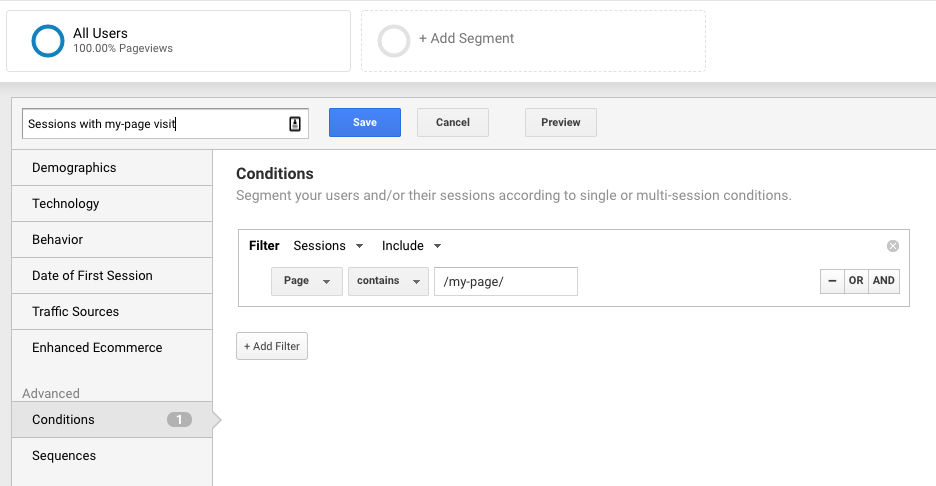
For more accuracy (most likely - see below), and for day-by-day graphs, you can use a segment. Create a new segment, and in the Conditions tab, filter Sessions to include those where Page matches the page you care about. You want to filter sessions even though you are counting users because you want users to count only when they visit the specific page. If you filtered on Users, and a person visited the page on day 1 of your date range and came back twice more without visiting the page, all 3 of those sessions would be included in the segment, and hence the user would count on 3 days even though they only visited the page once.

With that segment applied you can get the one-day numbers from the Audience > Overview graph (changed from displaying sessions to displaying users), or from the Audience > Active Users graph (displaying 1-day active users). You can also apply segments in API calls, which will allow you to get a table of this data without copying it out manually from the graph.
Now the "most likely" part: if you have enough hits to be subject to sampling, your segment will cause GA to apply sampling. It will take 500,000 sessions in your date range, count sessions, users, pageviews, etc in those sessions, and scale up those numbers to provide estimates for the total sessions. When you are looking at actions that are fairly common, it will be pretty accurate; if you are looking at actions that are rare it often will not be. That's why this might not be more accurate than the approximation given you by Unique Pageviews.
If you just want to look at a specific day or small number of days, setting the date range to each single day in turn will most likely eliminate sampling, giving you as much accuracy as GA can provide.


